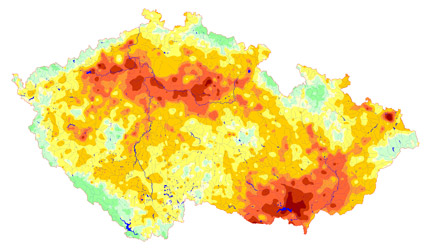
1984 - 1996
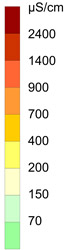
2007 - 2010
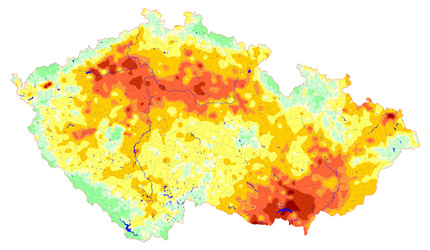
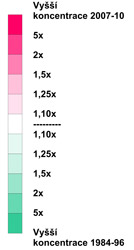
Difference of conductivity [2007/2010] - vodivost [1984/1996]
Map of collected samples
Distribution map of pH
Concentration maps: SO4, NO3, Cl-, F-, Ca, As, Be, Cd, Cu, Pb, Zn
 ČESKY
ČESKY