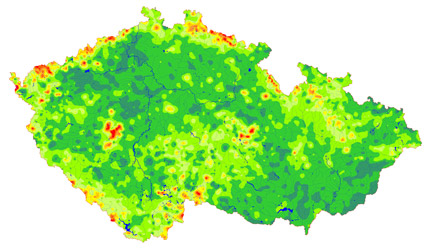
pH distribution maps
1984 - 1996
 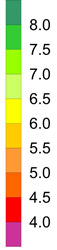 
2007 - 2010
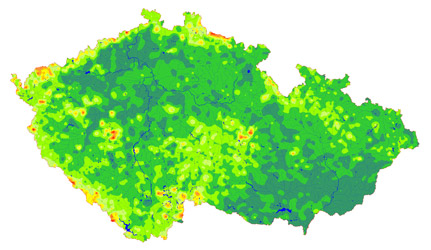
pH difference pH [2007/2008] - pH [1984/1996]
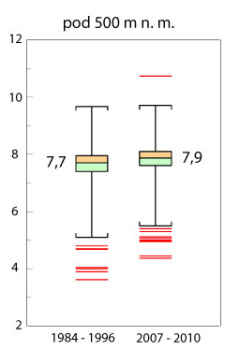
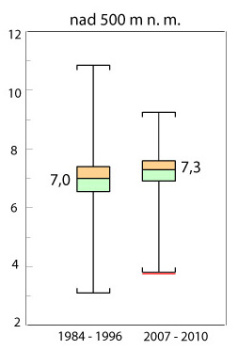
pH in water samples sampled in 1984 - 1996 and 2007 - 2010
Numbers in the plots represent median.
Back to results
Map of collected samples
Distribution map of conductivity
Concentration maps: SO4, NO3, Cl, F, Ca, As, Be, Cd, Cu, Pb, Zn
|
 |
|
 ČESKY
ČESKY